Decoding the Mystery: What Is Rsi? 🤔

Imagine you’re a detective trying to solve a mystery, but instead of a crime, you’re uncovering secrets in the stock market. That’s where RSI, or the Relative Strength Index, comes into play. It’s like a magnifying glass that helps us see how strong or weak Bitcoin, or any stock, really is by comparing recent wins to recent losses. Think of it as a score between 0 to 100 that whispers if Bitcoin is getting too popular (might be time for a break) or not popular enough (maybe it’s time to shine).
Now, RSI isn’t just random numbers; it’s a careful calculation that considers the ups and downs over a specific period, usually 14 days. Let’s simplify it: When the RSI score is beyond 70, it’s like a crowded party, indicating Bitcoin may be overvalued. On the flip side, if the score dips below 30, it’s like a quiet room, suggesting Bitcoin might be undervalued. Here’s a quick glance at what those RSI ranges mean:
| RSI Range | Market Condition |
|---|---|
| Below 30 | Undervalued ➡️ Potential Buy |
| Above 70 | Overvalued ➡️ Potential Sell |
So, RSI helps traders make more informed decisions, not just based on feelings or hunches, but grounded in the analysis of market strength. Remember, it’s not about predicting the future; it’s about understanding the current state to make smart moves. 🕵️♂️📈
Spotting the Difference: Understanding Divergence 🌈
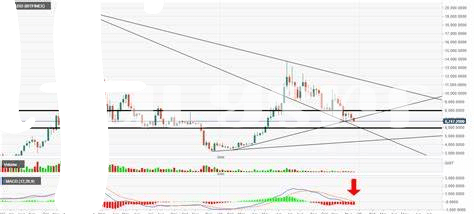
Imagine you’re looking at a picture of mountains, with ups and downs plotted on a graph, representing Bitcoin’s price over time. Now, think of RSI (Relative Strength Index) as a magic marker that draws another line, showing if these mountains of Bitcoin’s price are really strong or just pretending to be. Divergence happens when these two lines seem to be telling different stories. Sometimes the price might be climbing up to the sky, but the RSI line whispers, “Be careful, it’s not as strong as it looks.” Other times, the price might be sliding down, and RSI suggests, “Don’t worry, it’s stronger than you think.” It’s like uncovering hidden messages about what might happen next in Bitcoin’s thrilling adventure. This secret conversation between price and RSI can be a treasure map for those who learn to decode it, pointing towards moments when the winds of the market might be about to change.
Rsi and Bitcoin: a Special Relationship 💑

In the world of cryptocurrency, where the waves of prices can ebb and flow unpredictably, a beacon of understanding can be found in the RSI, or Relative Strength Index. This powerful tool lets us peek under the hood of Bitcoin’s market movements, revealing not just the surface splashes but the undercurrents that drive them. Imagine Bitcoin, the pioneering cryptocurrency, being in a kind of dance with RSI. 🕺💃 This duo works in harmony to show us signs that aren’t immediately apparent. RSI measures the speed and change of Bitcoin’s price movements, essentially telling us if Bitcoin is feeling a bit too excited (overbought) or a tad too gloomy (oversold). This special relationship becomes even more interesting when you consider Bitcoin’s infamous volatility. With its price known to make significant leaps and bounds, having a tool like RSI at your disposal is akin to having a seasoned guide in the wild territory of digital currency. This guide doesn’t just show the path; it reveals the footsteps of a hidden dance between supply and demand, fear, and greed. 🚀👀 Understanding this unique connection is crucial for anyone looking to navigate the high seas of cryptocurrency investing, making the journey a bit less daunting and a lot more informed.
The Secret Signals of Rsi Divergence 🔍

Peeking behind the curtain of Bitcoin’s price movements, we find a clever tool that may not be evident at first glance. This tool, known as RSI divergence, is like a treasure map pointing to hidden gems where the price might be heading in an unexpected direction. Imagine you’re looking at a graph, and while the price of Bitcoin seems to be moving in one way, the RSI indicator is sneakily going in another. This situation is a bit like discovering secret messages in a spy movie. The divergence, or the difference in direction, can be a telltale sign for traders. It whispers hints about whether Bitcoin is feeling overworked and needs a break (overbought) or if it’s been too quiet and might be gearing up for a big move (oversold).
Navigating these signals requires a sharp eye, but when spotted, they serve as a valuable guide. For instance, when the broader conversation is buzzing with bitcoin and the dark web suggestions, the RSI divergence might be quietly hinting at an upcoming change in Bitcoin’s price story, one that’s not yet on everyone’s radar. Acting on these clues is like picking the lock on the market’s next move – it’s all about timing and perspective. Reflecting on real-life scenarios, where these divergences have led to dramatic shifts, provides a playbook for anticipating future movements. By piecing together these secret signals, enthusiasts and traders alike can make more informed decisions in the thrilling world of Bitcoin.
Making Moves: When to Act on Divergence ⌚
Diving into the world of Bitcoin and RSI divergence, it’s like unlocking a treasure chest of insights – knowing exactly when to jump into action can significantly boost your trades. Imagine standing on a cliff, ready to dive into the sea; that’s akin to recognizing the perfect moment to make your move in the market. RSI divergence acts as our secret map, highlighting when the Bitcoin price and the RSI chart are not singing the same tune. Essentially, when you see the price of Bitcoin climbing higher, but the RSI indicator is taking a dip – it’s like a hidden whisper, hinting it might be time to sell. Conversely, if Bitcoin’s price is on a downhill slope but the RSI starts climbing up, think of it as a green light potentially signaling a great buy opportunity. Remember, it’s not just about jumping in at any divergence; timing and confirmation are key. A seasoned sailor knows when to set sail, and similarly, acting on these signals during major trends or after significant price movements could lead to more fruitful ventures.
Here’s a little cheat sheet to keep in mind:
| **Market Condition** | **RSI Divergence** | **Possible Action** |
|———————-|———————|———————-|
| Bitcoin Price Up | RSI Down | Consider selling |
| Bitcoin Price Down | RSI Up | Consider buying |
Getting this strategy right takes practice, but once you do, it’s like having a magic compass guiding your trading journey amidst the vast and unpredictable sea of cryptocurrencies. 🧭🚢🌊
Real-life Examples: Rsi Divergence in Action 🚀

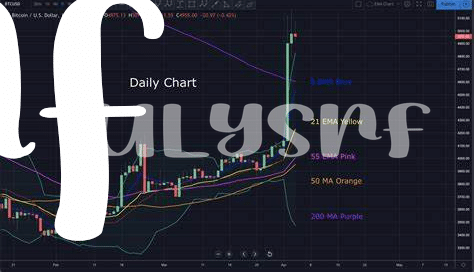
Imagine you’re looking at a chart, and you see Bitcoin’s price making a move. But when you glance at the RSI (Relative Strength Index), it tells a different story. This is where the adventure begins. By spotting these divergences, traders have been able to predict some pretty significant moves in the Bitcoin market. For instance, when Bitcoin’s price was climbing but the RSI was heading in the opposite direction, it hinted that the price might soon take a dip. And more often than not, those who noticed this signal and acted on it managed to navigate the market’s waves smartly. For anyone new to this, think of it as having insider info on whether the tide’s about to turn on Bitcoin’s beach. Learning from real-life instances ensures that you’re not just dealing with theory. It’s like having a map in a treasure hunt. For those interested in securing their Bitcoin gains, looking into bitcoin and the unbanked suggestions for cold storage methods can provide a safety net. This hands-on experience shows the importance of keen observation and timing, which can be crucial allies in your trading journey.
